
Labs
Working experiments: a way to explore an idea, see what it does, and refine it. Tools I maintain and use live on Open source.
Delivery-time uncertainty
Interactive prototype · Synthetic deliveries over real Oakland streets
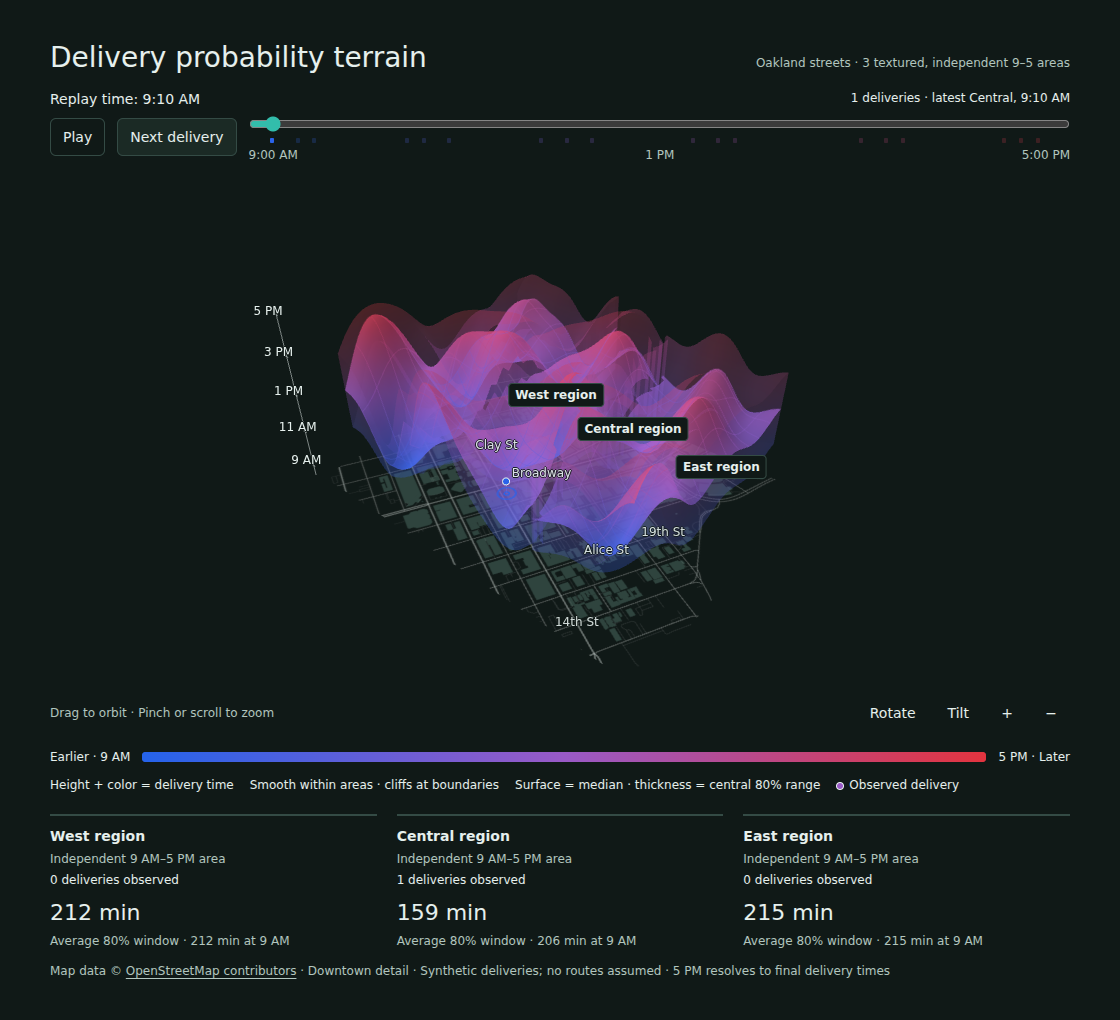
Run the interactive experiment here
Drag to orbit the map, or use the camera controls. Play or scrub the timeline. Requires WebGL 2; you can also open the standalone demo.
How can a map show both a delivery estimate and its uncertainty? Replay a day across three independent delivery areas. Height and color encode time; surface thickness shows the prediction interval. Nearby estimates narrow as observations arrive.
The deliveries and predictions are simulated. The final resolved surface is supplied by the demo; a handful of observations does not establish certainty everywhere.
Open the experiment · Source and model assumptions
Design constraints in context
Interactive demonstration · Illustrative shipment data
The Viewrule mock application combines navigation, charts, filters, a shipment queue, and detail drawers. Its Design lab introduces deliberate violations so you can compare their effects with the intended layout.
This is a teaching example. Opening it does not run the Viewrule CLI against your browser.