Empirical graphical perception
What to do and why
For precise magnitude comparisons, start with positions on a common scale (aligned dots or baseline bars). Use direct numeric labels when exact lookup matters. This recommendation follows the tested proportion-estimation tasks below; it is not a universal chart ranking. Do not transfer it unexamined to trend detection, geographic location, part-to-whole reading, or recall.
What was actually tested
Cleveland and McGill (1984), sections 4.3–4.5: two experiments using bar and pie charts compared position/length and position/angle judgments, with 51 usable subjects in each. Participants estimated a smaller value as a percentage of a larger one. Accuracy used log2(abs(judged percentage − true percentage) + 1/8), summarized using midmeans across subjects and means across charts. For position versus angle, the reported 95% bootstrap-based confidence interval for angle minus position mean log error was 0.79–1.15 (§4.4, p. 543). Lower error favors position. This is not a percentage-point reduction in business errors or a speed measurement.
Heer and Bostock (2010), experiment 1A: seven encoding types, ten 380×380-pixel charts per type, requested 50 responses per chart, using proportion estimates and the same log-error measure. The crowdsourced study preserved the broad position/length ordering. It did not support angle being worse than length, though position performed better than both and circular area worse than angle. Their stimuli and remote participant environment differ from a production dashboard. Do not interpret the requested assignments as a total unique-participant count.
Prefer, avoid, and exceptions
Prefer aligned positions when a reader needs to judge close numerical differences. Avoid relying only on circle size for precise ratios when a shared axis is practical. Area may be appropriate for a spatial overview or a compact hierarchy; add labels or a comparison view if exact values matter. Position can become hard to read with overplotting, insufficient space, or many series.
These experiments do not establish the best design for every population, screen, interaction, distribution, or decision. A ranking for one response measure does not prove superiority for every task. Test the relevant work, including correctness, time, and consequential mistakes, before claiming an improvement.
Examples
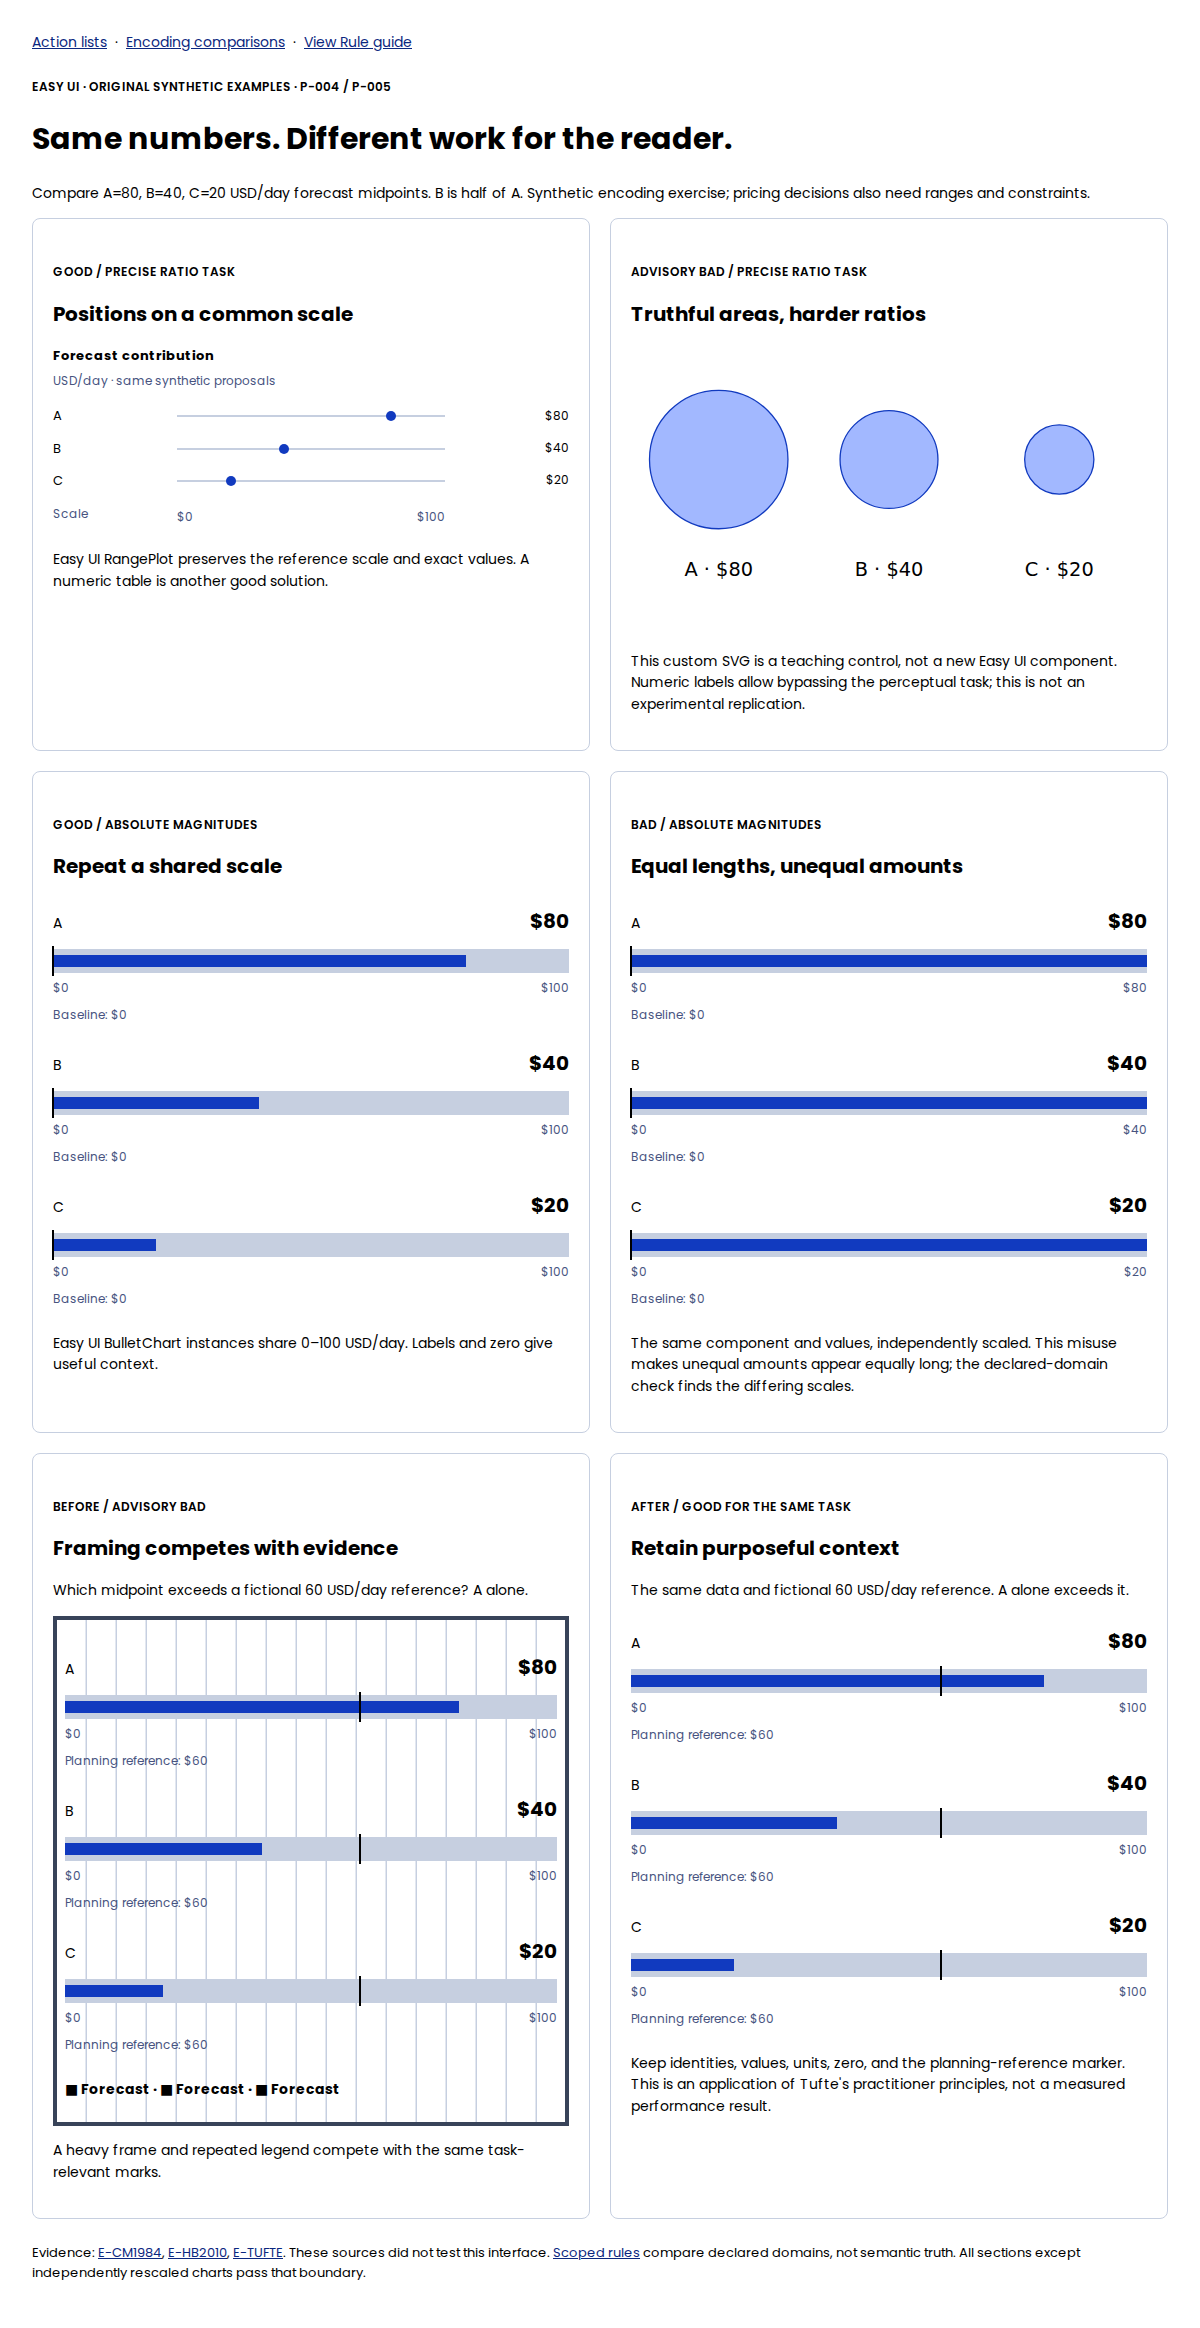
Good for ratio comparison: aligned positions use A=80, B=40, C=20 USD/day; B is half of A. A plain numeric table is another good solution for exact lookup.
Bad starting point for the same precise task: area-only comparison encodes the same values truthfully as circle areas. Diameters are proportional to square roots, not values. The numeric labels remain available so the example is accessible and inspectable; this also means it is not a replication of the experimental stimuli. Readers can bypass the perceptual task using those labels.
An additional bad design sizes circle diameters in direct proportion to values, making area quadratic. That would violate graphical integrity, unlike the truthful but task-disfavored area example. Do not conflate these two problems.
Rendered comparison screenshot, captured at 1200 CSS px wide and device scale 1. The Easy UI components, original area-control SVG, and accessible descriptions remain in the runnable gallery.
Evidence and limits
E-CM1984 and E-HB2010 are original experimental research. Neither tested our synthetic proposals, expandable rows, or business decisions. The gallery is an original illustration of an inference from their findings. No invented effect sizes or universal thresholds are added.
Automated checks and judgment
DR-001/DR-002 checks can validate declared common scales and baselines. A chart-type ban would overstate this evidence, so none is added. Both the aligned-position and truthful-area examples can pass the declared-domain check. Human review must verify the actual mapping and whether the encoding suits the task. Good geometry alone cannot validate that choice.