Tufte in practice
What to do and why
These are applications of practitioner principles, principally The Visual Display of Quantitative Information (E-TUFTE), not quotations or universal linter rules.
| Principle | Purpose and practical implication | Limit |
|---|---|---|
| Graphical integrity | Keep the mapping between number and mark honest; expose units, transforms, and material uncertainty. | Correct metadata does not prove that rendered marks are correct. |
| Data-ink | Reduce redundant graphical work so the evidence receives attention. | Labels, grouping, axes, and reference lines can help interpretation; do not remove them to maximize a ratio. |
| Chartjunk | Question ornament that competes with the intended reading. | Salience can have a communication purpose; this guide has no universal decoration score. |
| Comparison | Put related evidence in a form that permits the intended comparison. | Selection of relevant evidence still depends on the decision. |
| Small multiples | Repeat a stable chart grammar across related series. | Shared scales support absolute comparison; explicitly differing scales can support within-series shape. |
| Information density | Expose useful detail while preserving legibility. | More occupied pixels or less whitespace does not imply more useful information. |
Tufte's sparkline discussion develops nearby, repeated trends and explains how strong framing can dominate the information. Applied here, a restrained baseline and labeled values are useful context, not waste.
Prefer, avoid, and exceptions
Prefer common domains and plotting dimensions when comparing absolute amounts. For comparing variation within each series, labeled independent scales can be appropriate. State the task visibly; otherwise a reader may infer a magnitude comparison.
Ordinary amount bars encode distance from zero; do not crop that baseline to exaggerate differences. A line chart can use a restricted, labeled domain to inspect a small change. For example, a line of temperature from 19–21°C can reveal variation without implying that 21°C is visually many times 19°C. These are different encodings and tasks.
Retain whitespace that groups unrelated controls or separates independent decisions. A finite set of three alternatives does not become deficient because a larger screen has spare room.
Examples
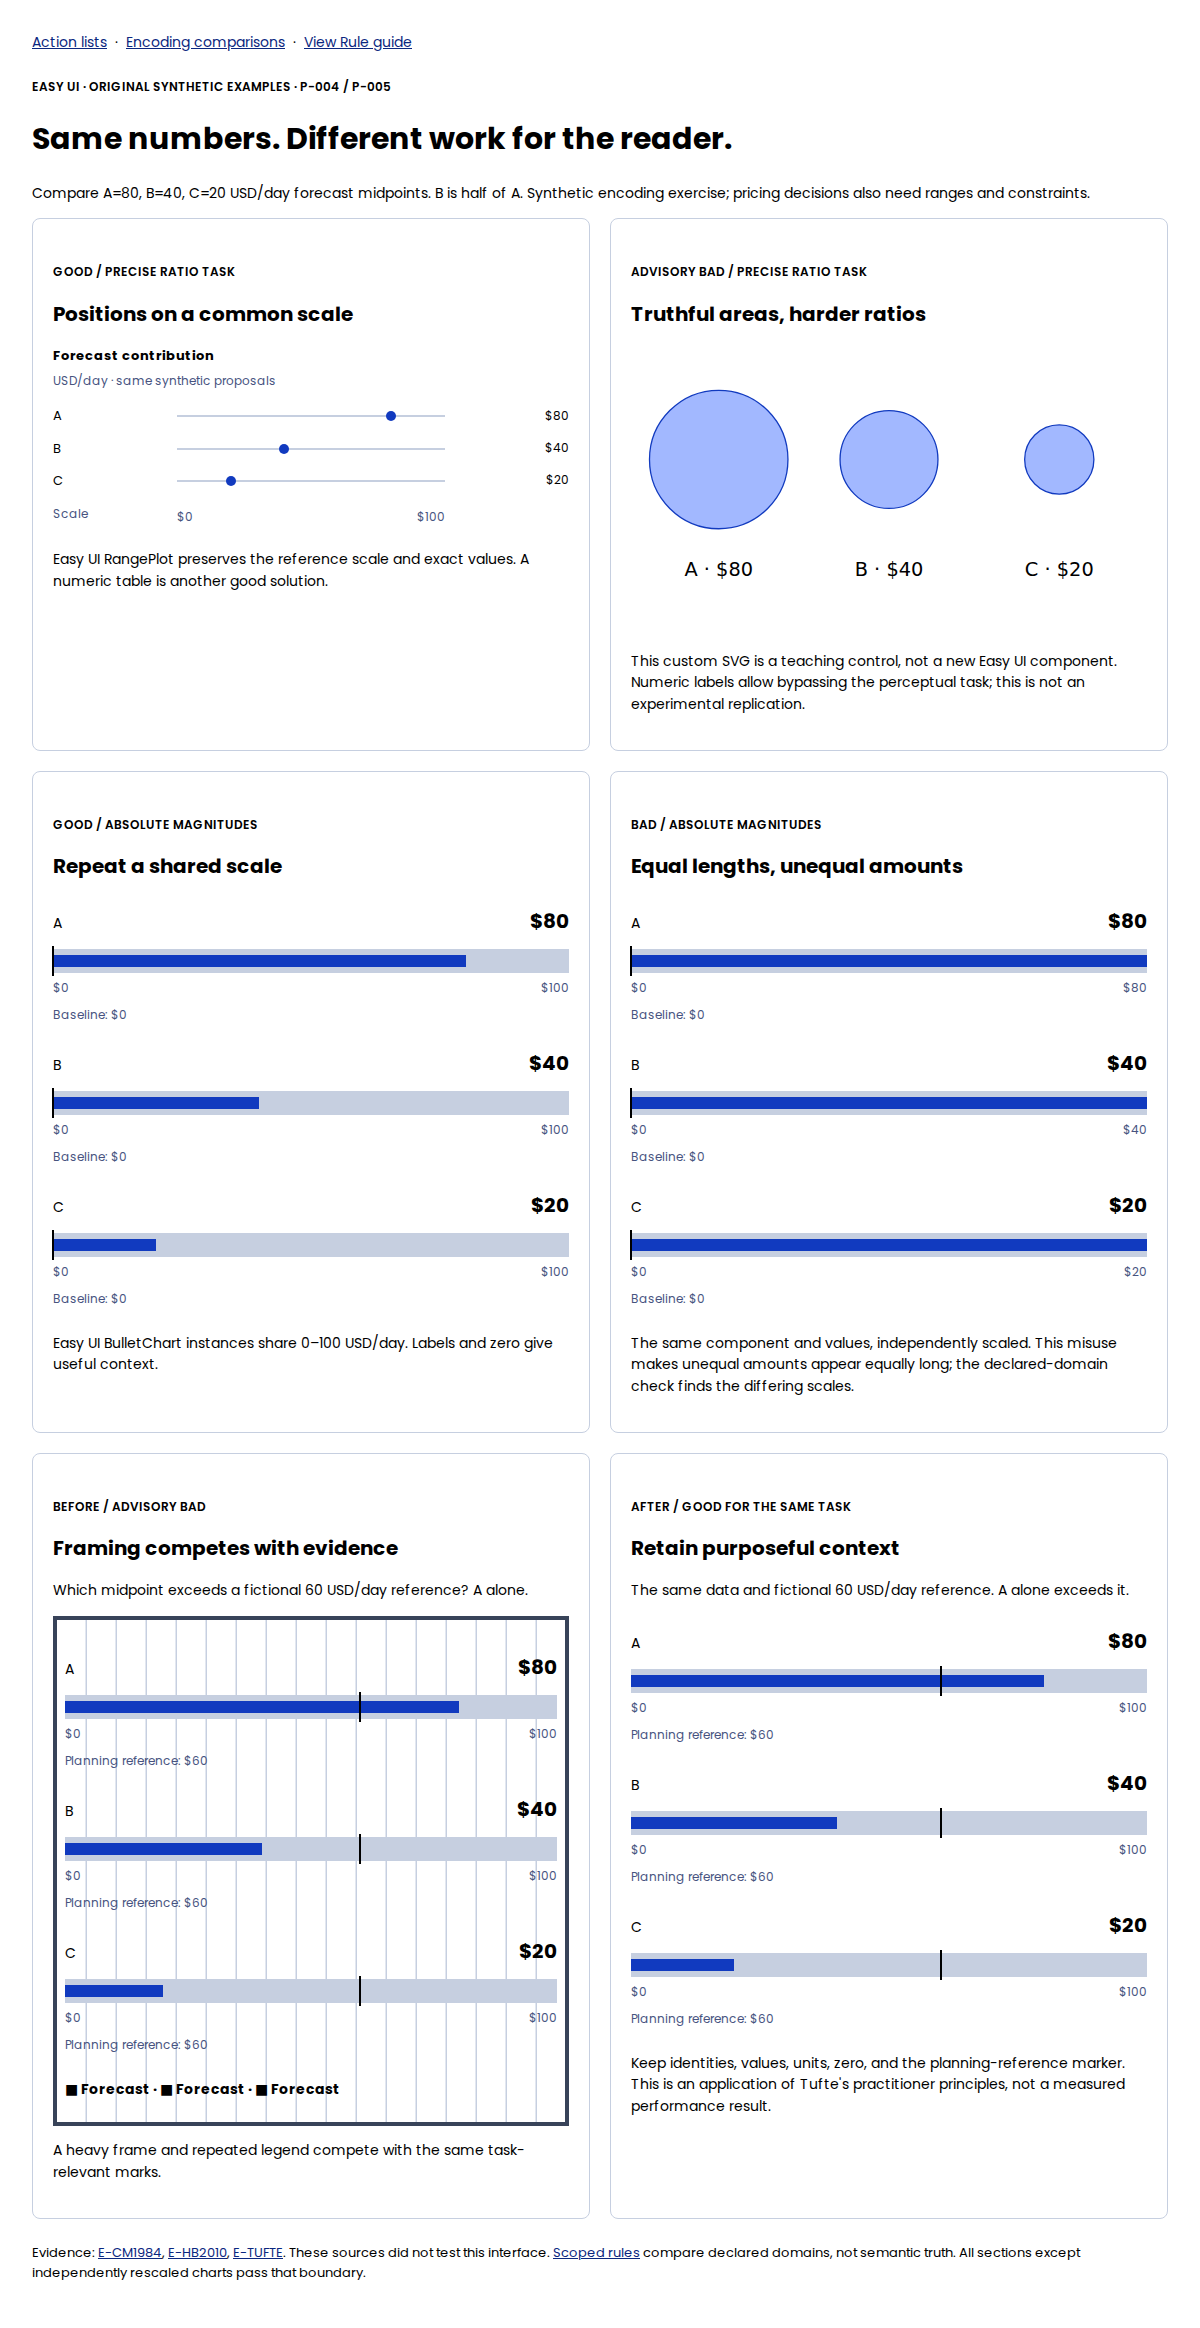
Good: shared small multiples show synthetic daily forecast midpoints A=80, B=40, C=20 USD on the same 0–100 scale. Labels and a baseline help compare amounts. These midpoints are for an encoding exercise; actual pricing approval also requires uncertainty and constraints.
Bad for absolute comparison: independently rescaled panels render each value as a full-width bar. The numerical labels remain truthful, but the equal lengths invite the wrong comparison. They are not wrong merely for using space differently.
Before: competing framing and after: purposeful context keep A=80, B=40, C=20 and a fictional 60 USD/day planning reference constant. The task is to identify which midpoint exceeds that reference. The after version removes a heavy frame, strong grid, and redundant legend, while retaining identities, values, units, zero, and the reference line. Removing the reference as “non-data ink” would make this task harder. Both versions can pass the declared-domain check; the visual recommendation is our inference from E-TUFTE, not an experimental result.
A second good design is a simple table of A=80, B=40, C=20 USD/day when exact lookup matters most. A second bad design removes units, identity labels, and reference lines in pursuit of “pure data ink.” The resulting marks require guessing their meaning. These are original examples, not reproductions of book illustrations.
Rendered comparison screenshot, captured at 1200 CSS px wide and device scale 1. The Easy UI components, original area-control SVG, and accessible descriptions remain in the runnable gallery.
Evidence and limits
E-TUFTE and E-SPARKLINES are practitioner principles. The principle table separates those ideas from Viewrule's implementation choices. It supplies no experimental effect size. For tested perceptual tasks and limits on generalization, see P-005.
Automated checks and judgment
DR-001/DR-002 can be expressed using consistent/attribute checks on declared scales and baselines; DR-003 can require visible context. The example contract checks renderer-declared domains. The installed regression expects encoding-shared-domain in the rescaled case. This detects inconsistent declarations, not truth independently recovered from SVG. Inspect the actual marks. DR-007/DR-008 do not justify arbitrary whitespace limits or automated bans on non-data ink.